
The randomized clinical trial offers our best tool for determining the efficacy of an intervention as compared to another. Whether it is a drug trial or diet trial, the devil is in the details. Reading the abstract does not give you the whole story, and it can be profoundly misleading.
For example, let us assess a popular randomized clinical trial testing the efficacy of different diets, performed by some of the biggest names in diet and obesity research, such as Dr. Frank Sacks and Dr. George Bray.
The conclusion of their study is simple. All diets are created equal.
This is the headline that makes it into the newspapers and becomes accepted as fact. Why question the results? Dr. Bray and Dr. Sacks and very well respected world-wide for their work; The New England Journal of Medicine is a prestigious journal. No sub-par work would get through the cracks.
When reading a dietary clinical trial, and assessing its internal validity, there are three major points to keep in mind:
- How large was the difference between assigned exposures?
- Is there any evidence that the study subjects followed the diet or intervention they were randomized to?
- When assessing a study testing varying carbohydrate content, is there any difference in triglyceride levels between the groups?
Difference between assigned exposures
The nutrient goals for the four diet groups were:
Low fat, average protein - 20% fat , 15% protein, and 65% carbohydrates
Low fat, high protein - 20% fat, 25% protein, and 55% carbohydrates
High fat, average protein - 40% fat , 15% protein, and 45% carbohydrates
High fat, high protein - 40% fat, 25% protein, and 35% carbohydrates
This was how they described it in the paper. Of course, the low fat, average protein group could also be called high carbohydrate group, and the high fat, high protein group could be called low(er) carbohydrate group.
Right away, this study design is somewhat worrisome, since the carbohydrate content of the diets are relatively similar. Determining a 10% difference in macronutrient content is likely unrealistic, since study subjects tend to cheat on their diets and the dietary assessments are subpar. This concern is further compounded by this seemingly innocuous sentence buried in the methods:
"Blinding was maintained by the use of similar foods for each diet."
At first glance this would be great. Blinding adds to the rigor of the study design, by keeping the study subjects in the dark as to which intervention they are receiving. However, in a diet study, this is very difficult. The only way this can be done properly is when foods are chemically modified to contain different nutrients, while still maintaining the same look, smell, and taste of the original food. This has been done beautifully in the Minnesota Coronary Survey, testing the potential benefits of a low saturated fat diet. Although rarely mentioned in the scientific literature, it was a very large, double blinded study that chemically altered the fat composition of various popular foods served to the institutionalized study subjects. (On a side note, this study found absolutely no benefit to eating a low saturated fat diet.)
However, blinding a study comparing different percentages of carbohydrates, protein and fat is essentially impossible without making each intervention very similar.
Is there any evidence that the study subjects followed the diet or intervention they were randomized to?
This is the giant elephant in the room of every dietary clinical trial. It is an enormous problem that nobody really talks about, and it is the major inspiration for developing PhotoCalorie. The "gold-standard" in dietary research in the year 2012 is pen and paper. We have machines that can literally look through your skin and see your organs and bones in vivid detail. We can tell who your parents are, simply by a drop of your spit. Yet when we study obesity, arguably the most important disease that plagues the world today, we use technology from 1812.

In this particular study, the gold standard was not used. They instead used a 24-hour recall twice throughout the 2 year study in 50% of the patients. In other words, out of the 730 days and 811 study subjects, the primary intervention was only measured on 6 days in 405 people.
6 DAYS! 0.8% of the days. Assuming they ate 3 meals a day, this means out of 2,190 meals they ate, only 18 of them were reported!
Compounding this unfortunate number is the fact that a 24-hour recall is far from perfect, and people tend to forget what they ate, and report foods deemed healthier more often.
Given all these limitations, here is what the study subjects reported eating. The left three columns correspond to the low fat, average protein group and the right three are for the low fat high protein groups, at 6 months and two years follow up:
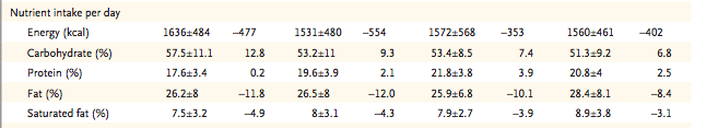
As you can see, the macronutrient composition is virtually identical. At 2 years the low fat, average protein group was eating 1531 calories, 53% from carbs, 19.6% from protein, and 26.5% from fat. The low fat high protein group was eating 1560 calories, 51.3% from carbs, 20.8% from protein, and 28% from fat.
When assessing a study testing varying carbohydrate content, is there any difference in triglyceride levels between the groups?
There are other, more objective ways, to assess dietary adherence in such studies. When comparing groups with varying levels of carbohydrates, one excellent tool is the triglyceride levels in the study subjects. Simply stated, when people eat lots of carbs, their triglycerides go up (and their HDL usually goes down). Here is the data from the Sacks study:
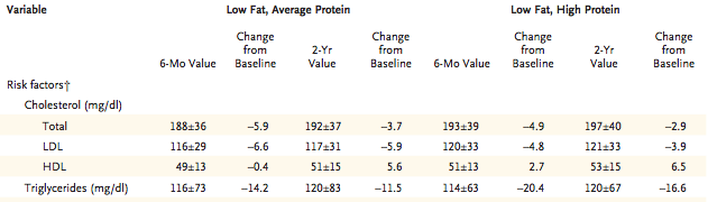
The triglyceride levels at 6 months and 2 years are virtually identical. Same with the HDL levels.
---
The authors conclude in the discussion that the "principal finding is that the diets were equally successful in promoting clinically meaningful weight loss and the maintenance of weight loss over the course of 2 years."
When you combine all these clues together - the blinded study design, the similar reported macronutrient intake, the identical triglycerides and HDL levels - you come to a dramatic conclusion that explains why all the groups were equally successful: They were all eating the exact same diet!
---
Tried a paleo or carb-restricted diet? Join the registry today!
---
The authors conclude in the discussion that the "principal finding is that the diets were equally successful in promoting clinically meaningful weight loss and the maintenance of weight loss over the course of 2 years."
When you combine all these clues together - the blinded study design, the similar reported macronutrient intake, the identical triglycerides and HDL levels - you come to a dramatic conclusion that explains why all the groups were equally successful: They were all eating the exact same diet!
---
Tried a paleo or carb-restricted diet? Join the registry today!
 RSS Feed
